Debugging an S32G2 based board using NXP S32 Design Studio
In this tutorial, we will set up a Debugger using the NXP S32 Design Studio for the S32G2 board.
Assumptions
- An S32G2 board is functional and accessible.
Prerequisites
-
An S32G2 board connected to the Sleeve Dock.
-
A configured Workspace for the S32G2 board. If you have not created a Workspace yet, follow this guide: How to create a new Workspace.
Container Image Links
Get the NXPS32DS Desktop Image from this URL: registry.gitlab.com/sleeve.dev/nxp/s32-design-studio:latest
Preparing the Actions
The NXPS32DS Desktop Action
In your S32G2 Workspace, create an Action by clicking on the button, then select Container and Desktop. Fill in the initialization fields as follows:
| Field | Value |
|---|---|
| Name | nxp-S32-Design-Studio |
| Container Image | NXPS32DS Image |
| CPU Architecture | Native |
| Keyboard | Empty (select a different language if you prefer) |
| Username | sleeve |
| Password | sleeve |
Leave the rest empty and create the Desktop Action.
NXP S32 Design Studio
- Start the NXP S32 Design Studio
Warning
- Due to a bug, possibly because of an older version of S32DS, the program might crash the first time after pressing Launch. This only happens once; subsequent attempts will work as expected.
-
From the Project Explorer tab, click on Create a project…
-
From the New Project panel that opens, select S32DS Application Project under S32DS Projects.
-
From the S32DS Application Project panel that opens, name your project and select a processor core.
Example
An example core: S32G233A Cortex-M7
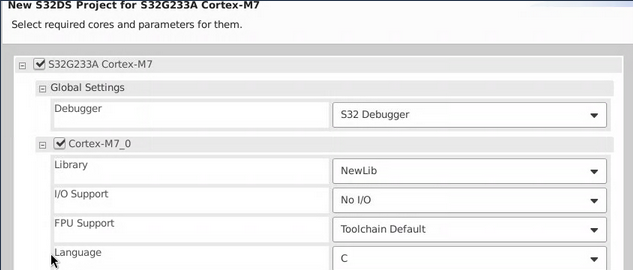
- Click on the Next button and make sure the S32 Debugger is selected under the Global Settings - Debugger
Example
-
Select Run -> Debug Configurations from the top menu.
-
Select SleeveProject_Debug_ram_S32Debug under the S32 Debugger.
-
Select the Debugger tab from the panel that opens on the right.
Debugging Using an Ethernet Connection
-
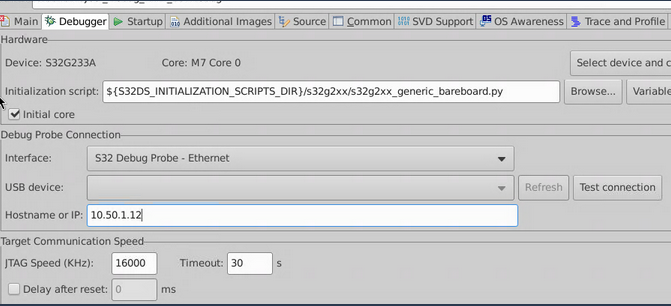
For interface, select S32 Debug Probe - Ethernet.
-
Fill in the IP box with Debugger IP address.
-
Click on the Apply button and then the Debug button.
-
Confirm the switch to debug view popup.
Example
Debugging Using a USB Connection
-
For interface, select S32 Debug Probe - USB.
-
Click on the Apply button and then the Debug button.
-
Confirm the switch to debug view popup.
Success
You are now Debugging the board!
Troubleshooting
Question
Any other troubles? Click here!